Implement Countermeasures (PDSA)
activity
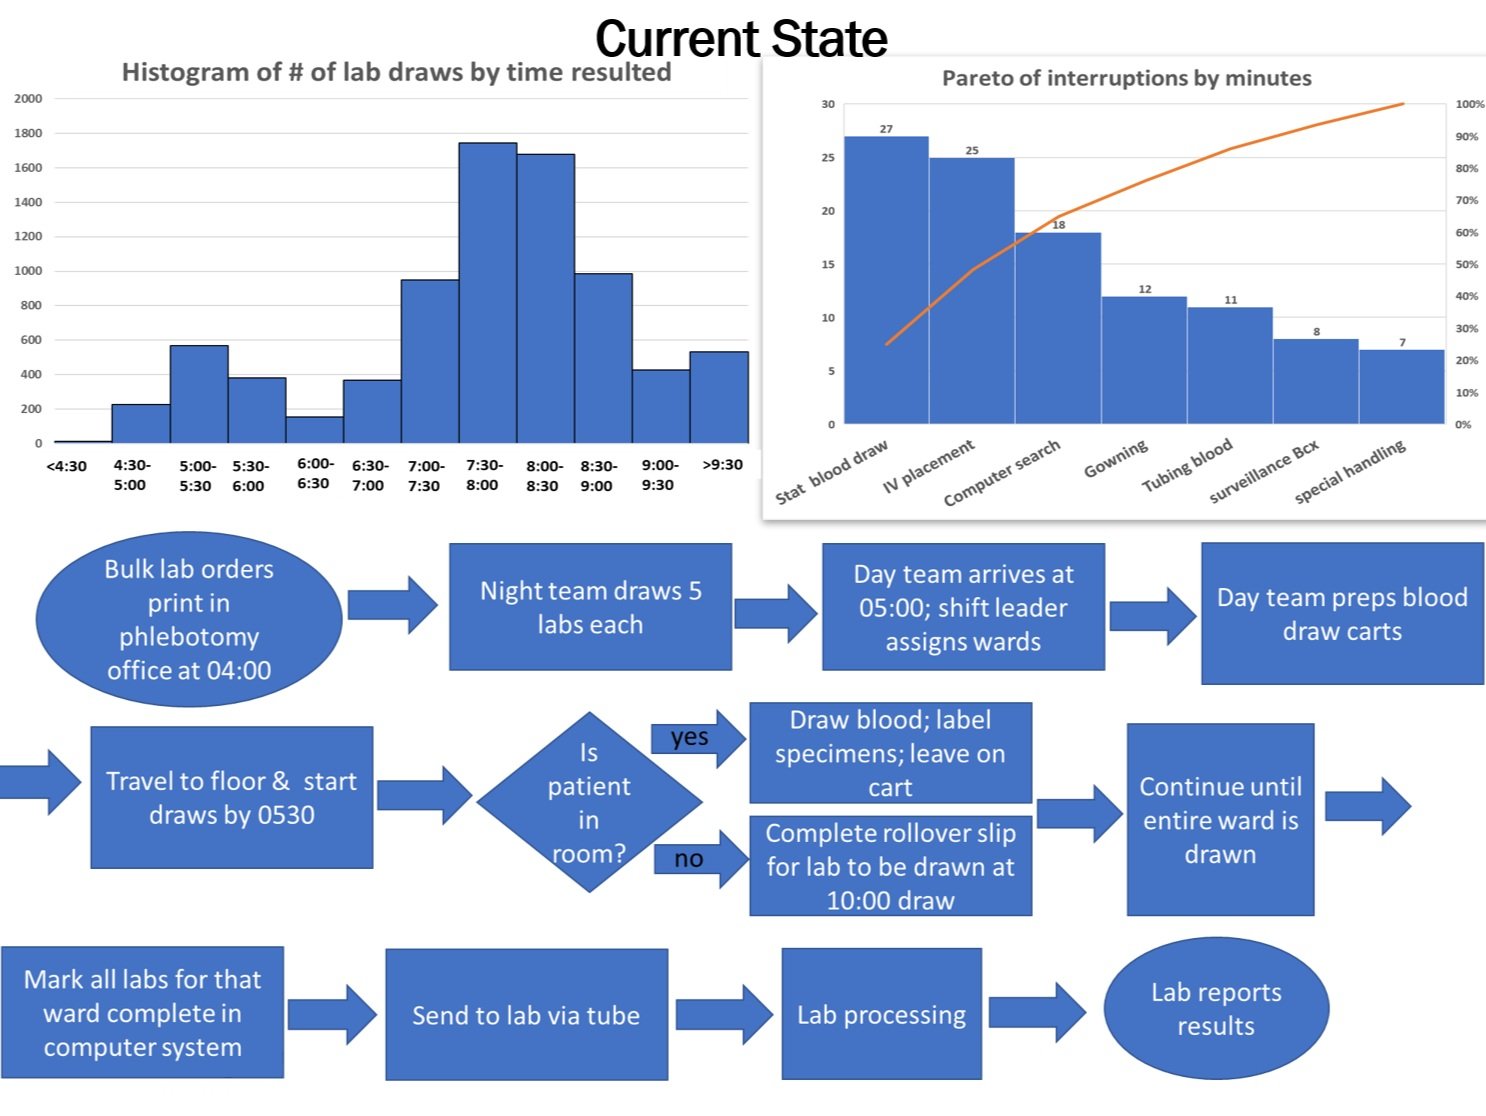
Typically you will run multiple PDSA cycles to fix a problem. For the sake of time, we will only run one PDSA cycle that you will monitor over 3 months. Choose the link below that best matches the type of intervention you would like to implement.
Link to Blue PDSA Month One Data (hire staff, change staffing schedules)
Link to Green PDSA Month One Data (education intervention, pre-stocking carts)
Link to Orange PDSA Month One Data (night team performing more blood draws)
Graph the results of your intervention. The links to PDSA data (above) will open in a new page so you can use this page to graph your results. Please be aware, if you leave this page your graph results will reset. Add data from the links above to the colored squares (yellow for month 1, green for month 2, purple for month 3) on the graph below.


